CoinDesk analyst and Chartered Market Technician Omkar Godbole offers a daily review of leading tokens with CME futures.
Bitcoin: Continues to Trade Sideways as MACD Indicates Potential Downturn
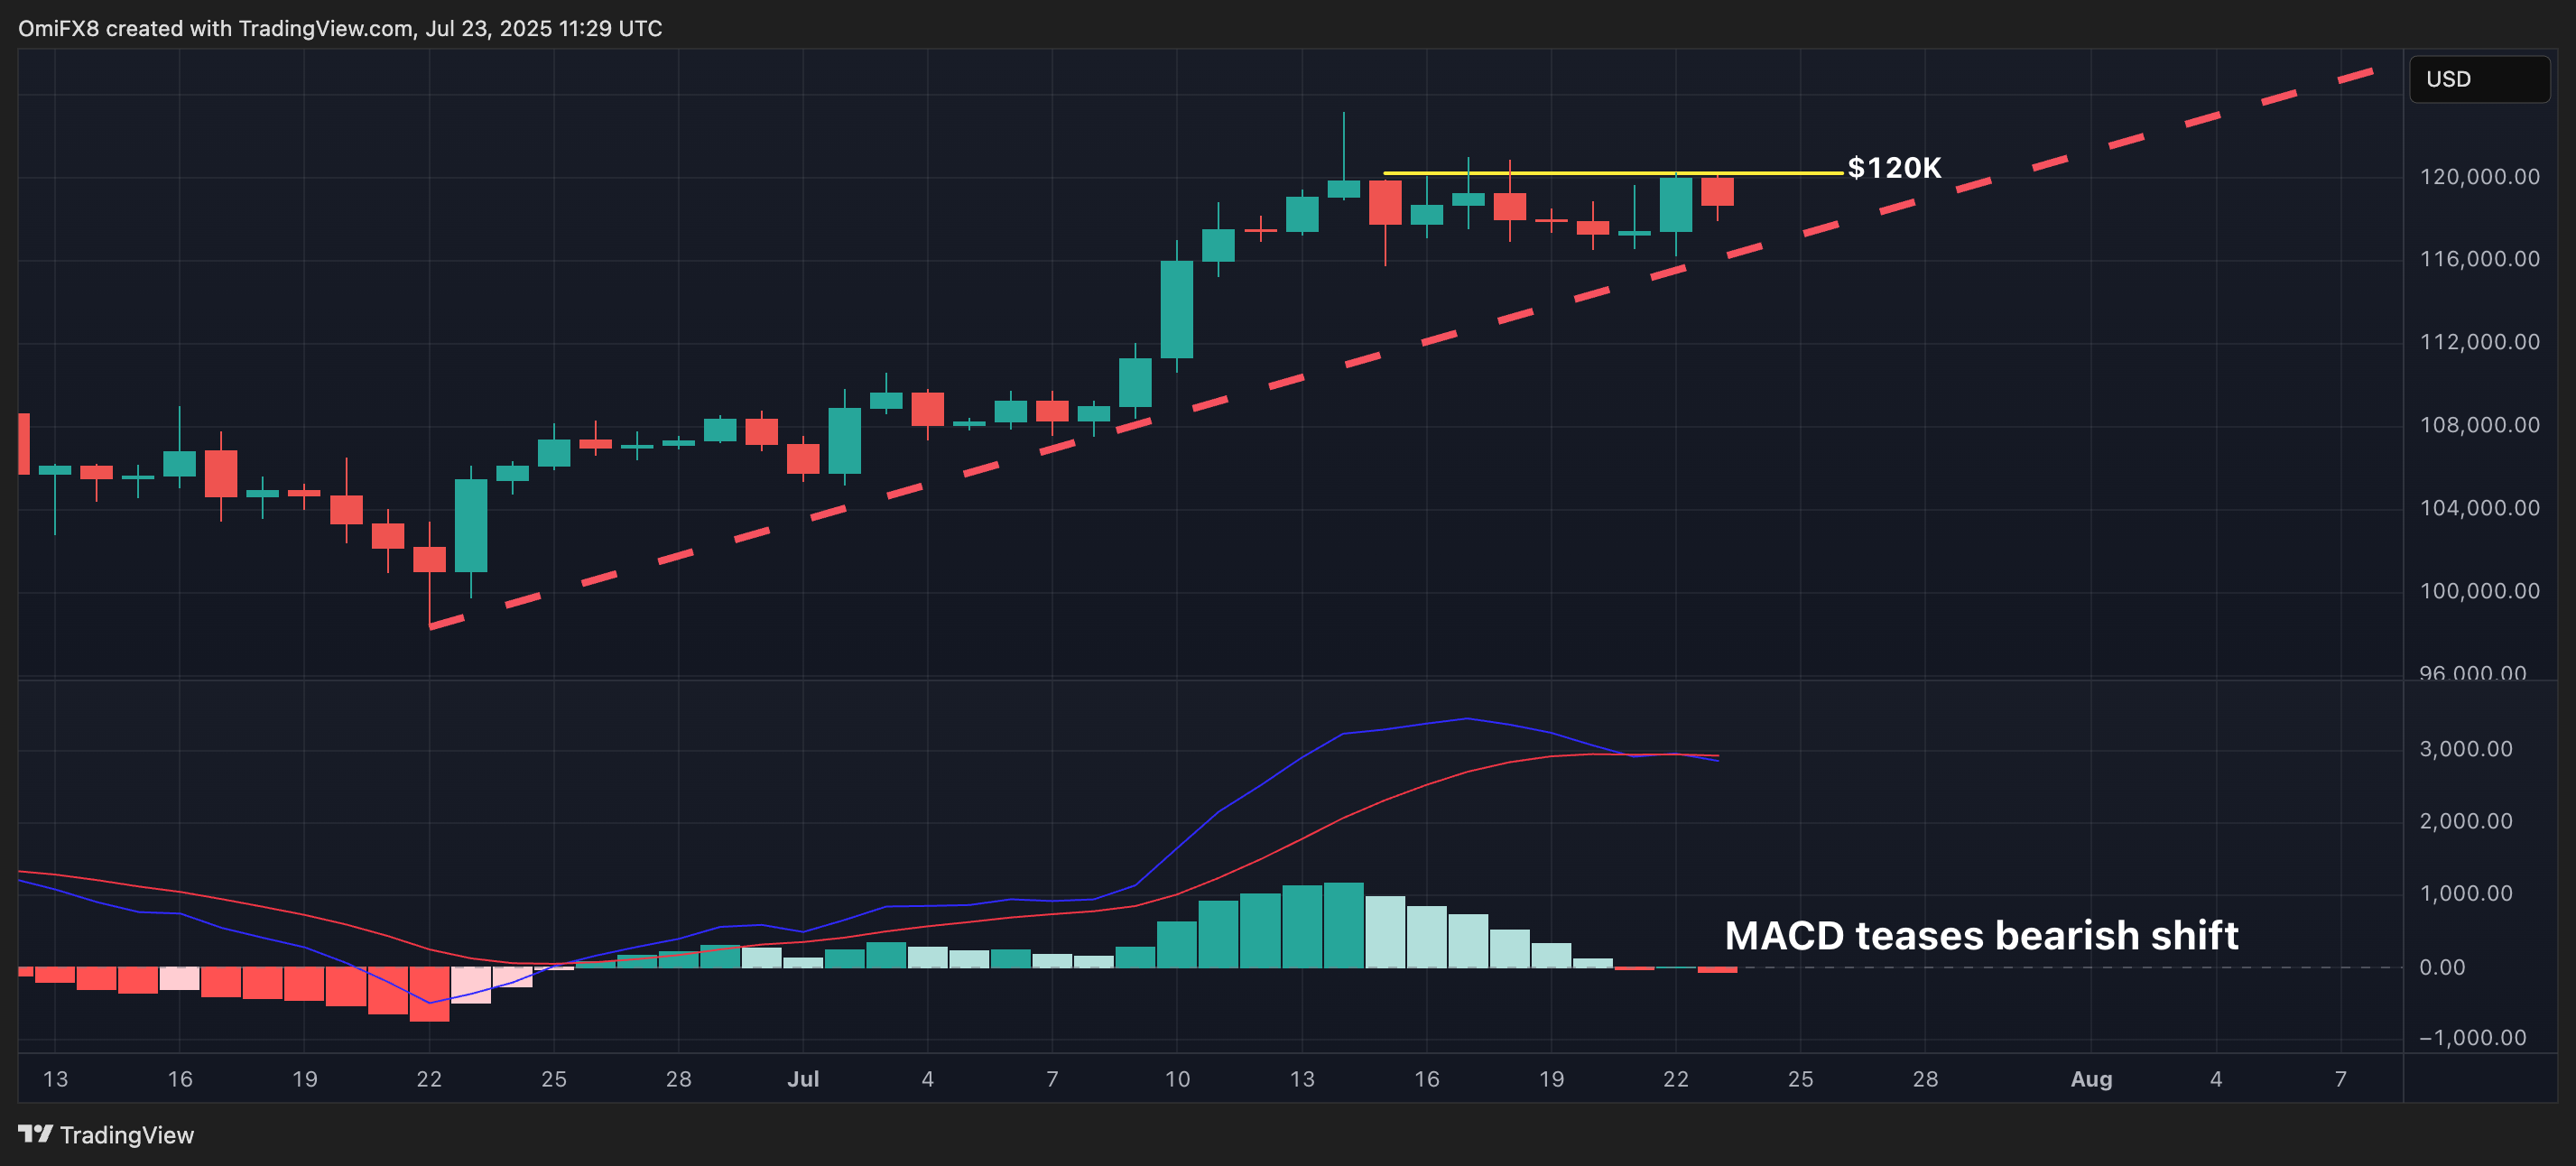
On July 14, Bitcoin (BTC) reached a new peak exceeding $123,000 before entering a consolidation phase. Since then, the price has fluctuated between a resistance level of $120,000 and support at $116,000, with buyers unable to push it above the former in the last 24 hours.
This volatile trading, coupled with the leveling of intraday moving averages and daily MACD histogram signaling a possible bearish turn, increases the likelihood of a pullback. However, the ascending trend line from June lows remains unbroken, keeping hopes alive for a bullish resurgence that might set new records.

- AI’s Insight: Bitcoin is losing steam as it consolidates below the $120,000 barrier, with the MACD histogram suggesting a potential bearish turn.
- Resistance: $120,000, $123,181.
- Support: $116,000, $115,739, $111,965.
XRP: July’s Positive Trend Faces Potential Reversal
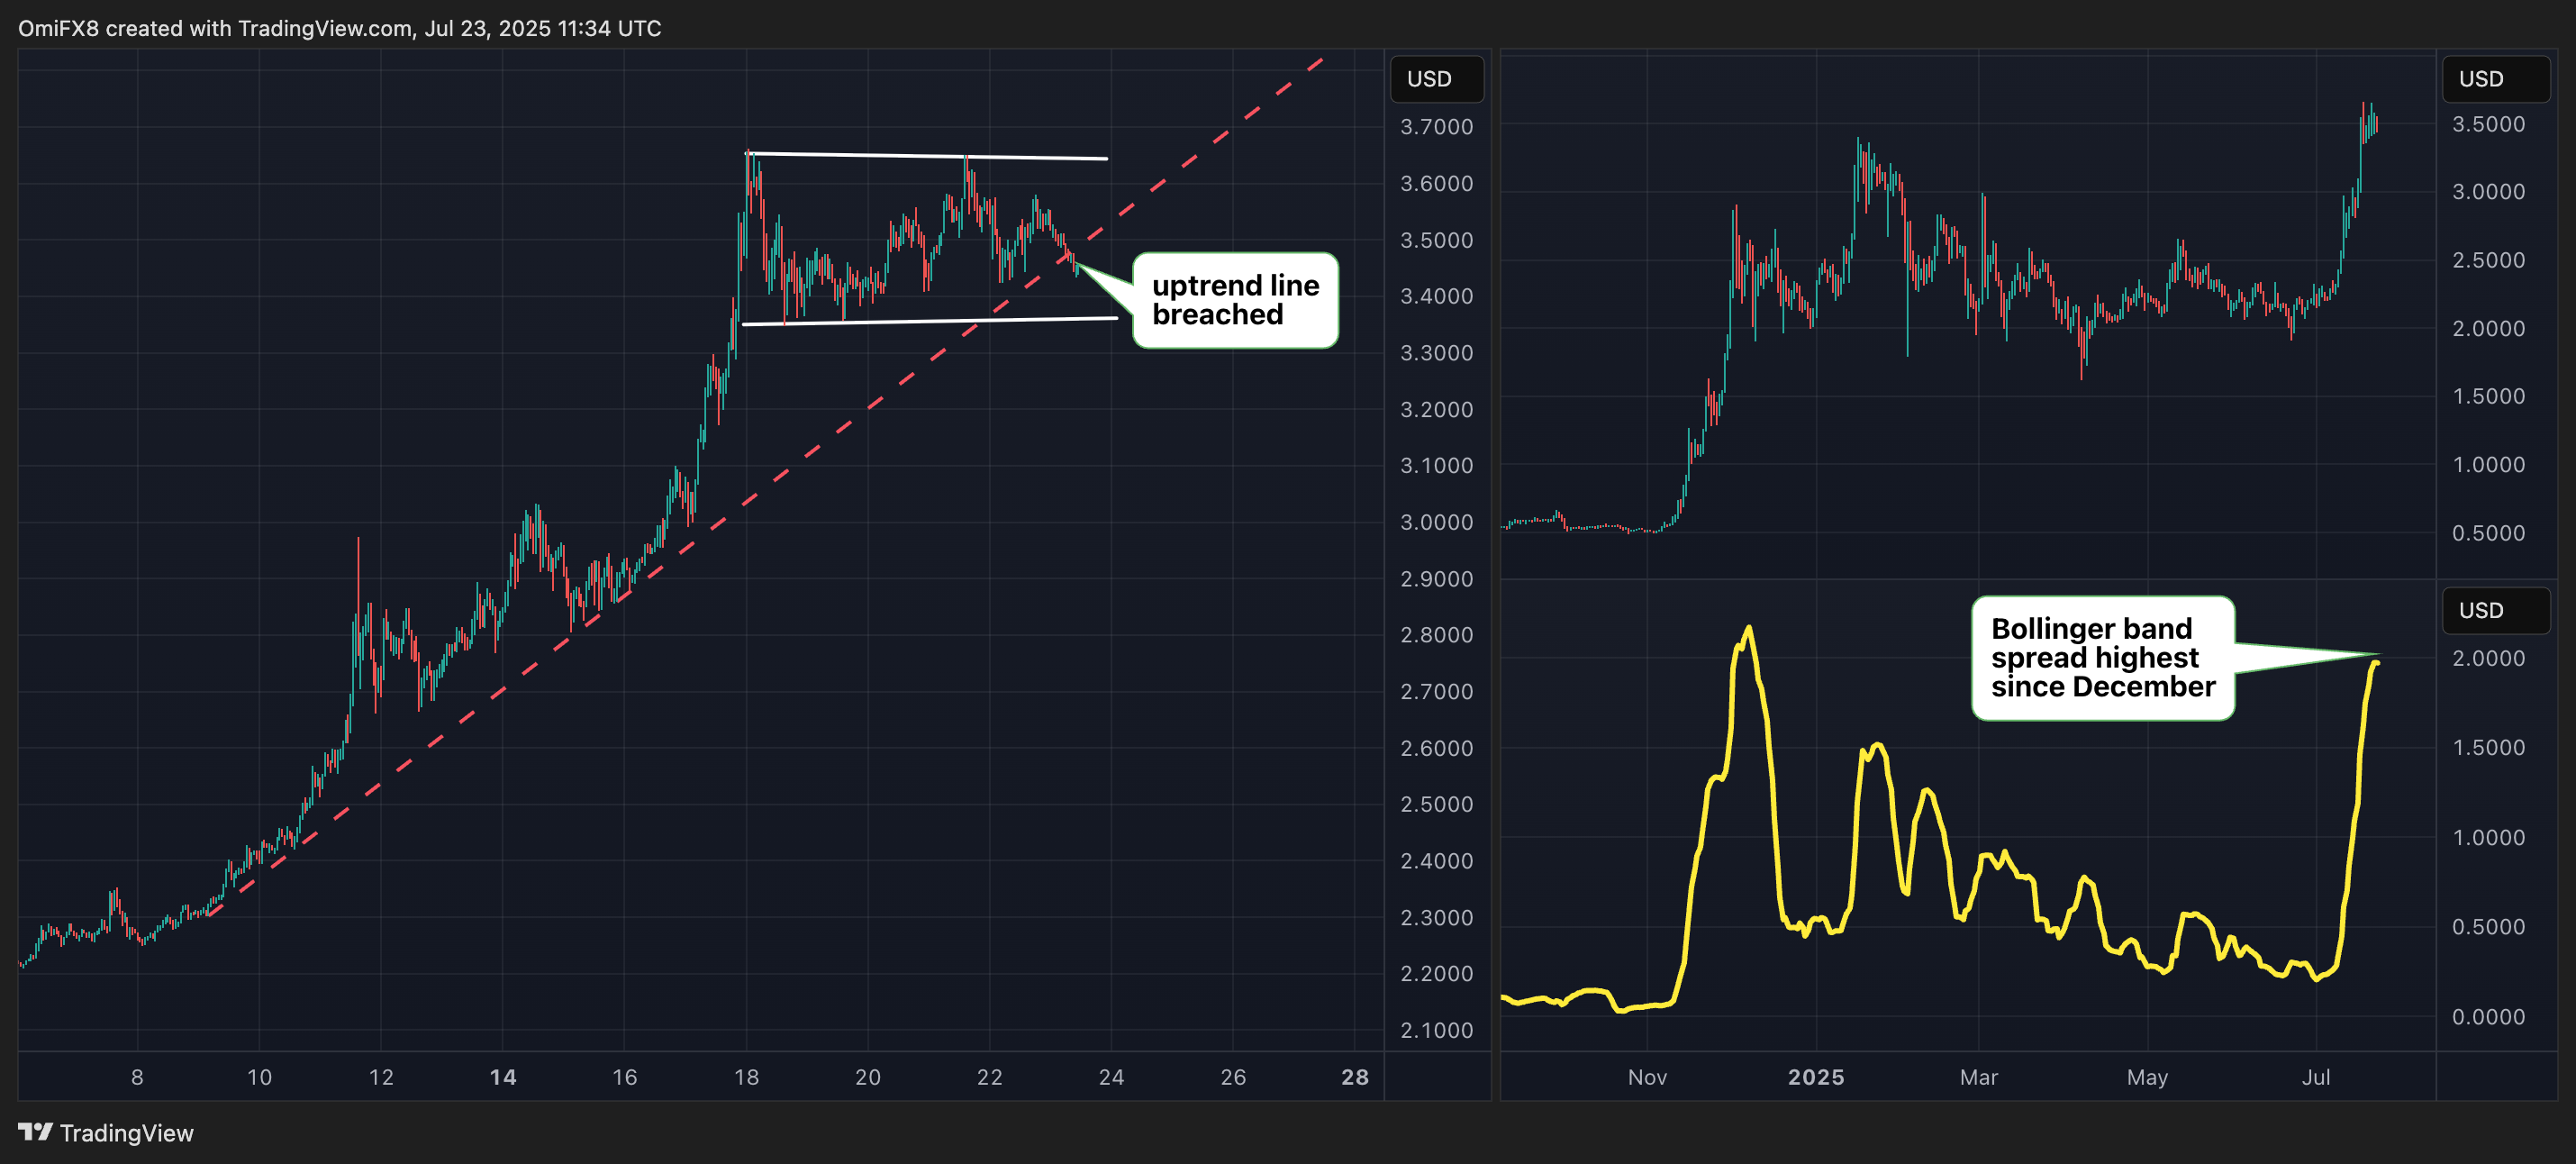
Similar to BTC, XRP (XRP) has been trading without clear direction, fluctuating between $3.35 and $3.65. A significant change in the past day is the break of the trendline that marked the price rise from $2.2 to its peak, increasing the likelihood of a bearish outcome from the current range.
Moreover, the widening of Bollinger bands to levels last seen during the December correction indicates growing volatility. These bands measure volatility by positioning two standard deviations above and below the asset’s 20-day simple moving average.
If the lower boundary of the current range fails to hold, there is a risk of a further downward move.

- AI’s Insight: The Bollinger Band spread reaching a multi-year high suggests extreme volatility and a potential pause, but the break of the uptrend line is a warning for bulls.
- Resistance: $3.65, $4
- Support: $3.35, $3, $2.65.
Ether: Anticipating Consolidation as Bollinger Bands Expand
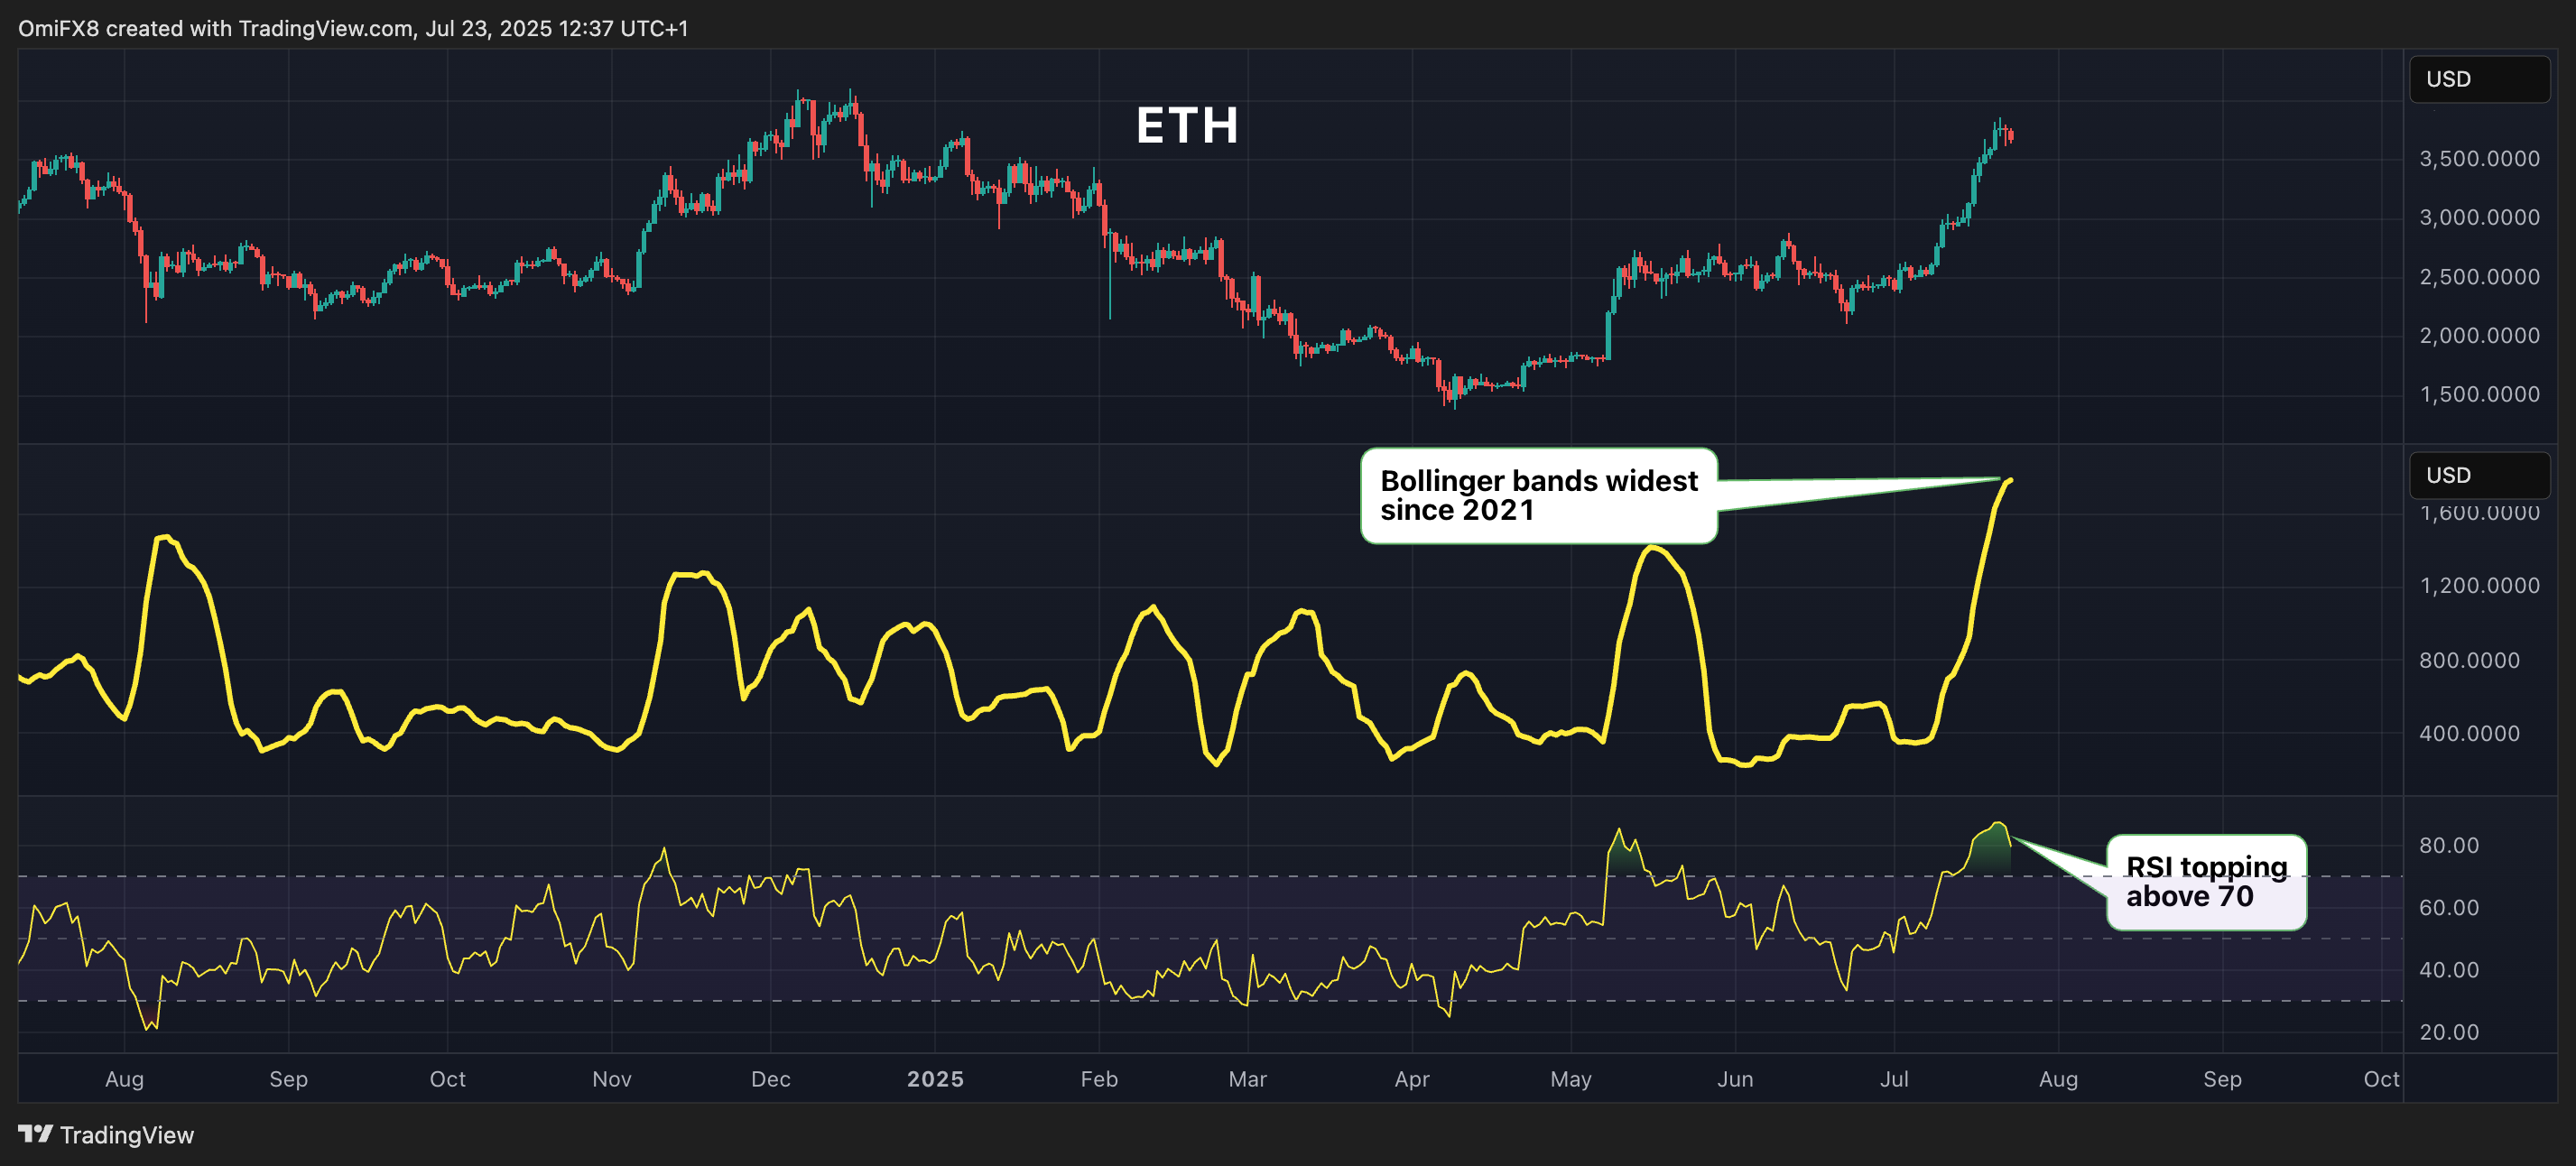
After a strong rise from its June lows near $2,200, Ether (ETH) has stalled this week, with prices retreating from a high of $3,850 to $3,600. A short-term consolidation within a wide range seems likely as the daily chart’s Bollinger Bands have reached their widest since April-May 2021.
This widening is a classic technical signal indicating that the market has undergone a period of high volatility and strong directional movement, suggesting it may now enter a period of consolidation or a “breather” before its next major move. This perspective is supported by the 14-day relative strength index, which has peaked in the overbought zone above 70.

- AI’s Insight: Ether’s rally has pushed its RSI above 70 and widened the Bollinger bands to their highest level since 2021, signaling an overbought market.
- Resistance:$4,000, $4,109, $4,382.
- Support: $3,480, $3,081, $2,879.
SOL: Bullish Outlook Persists
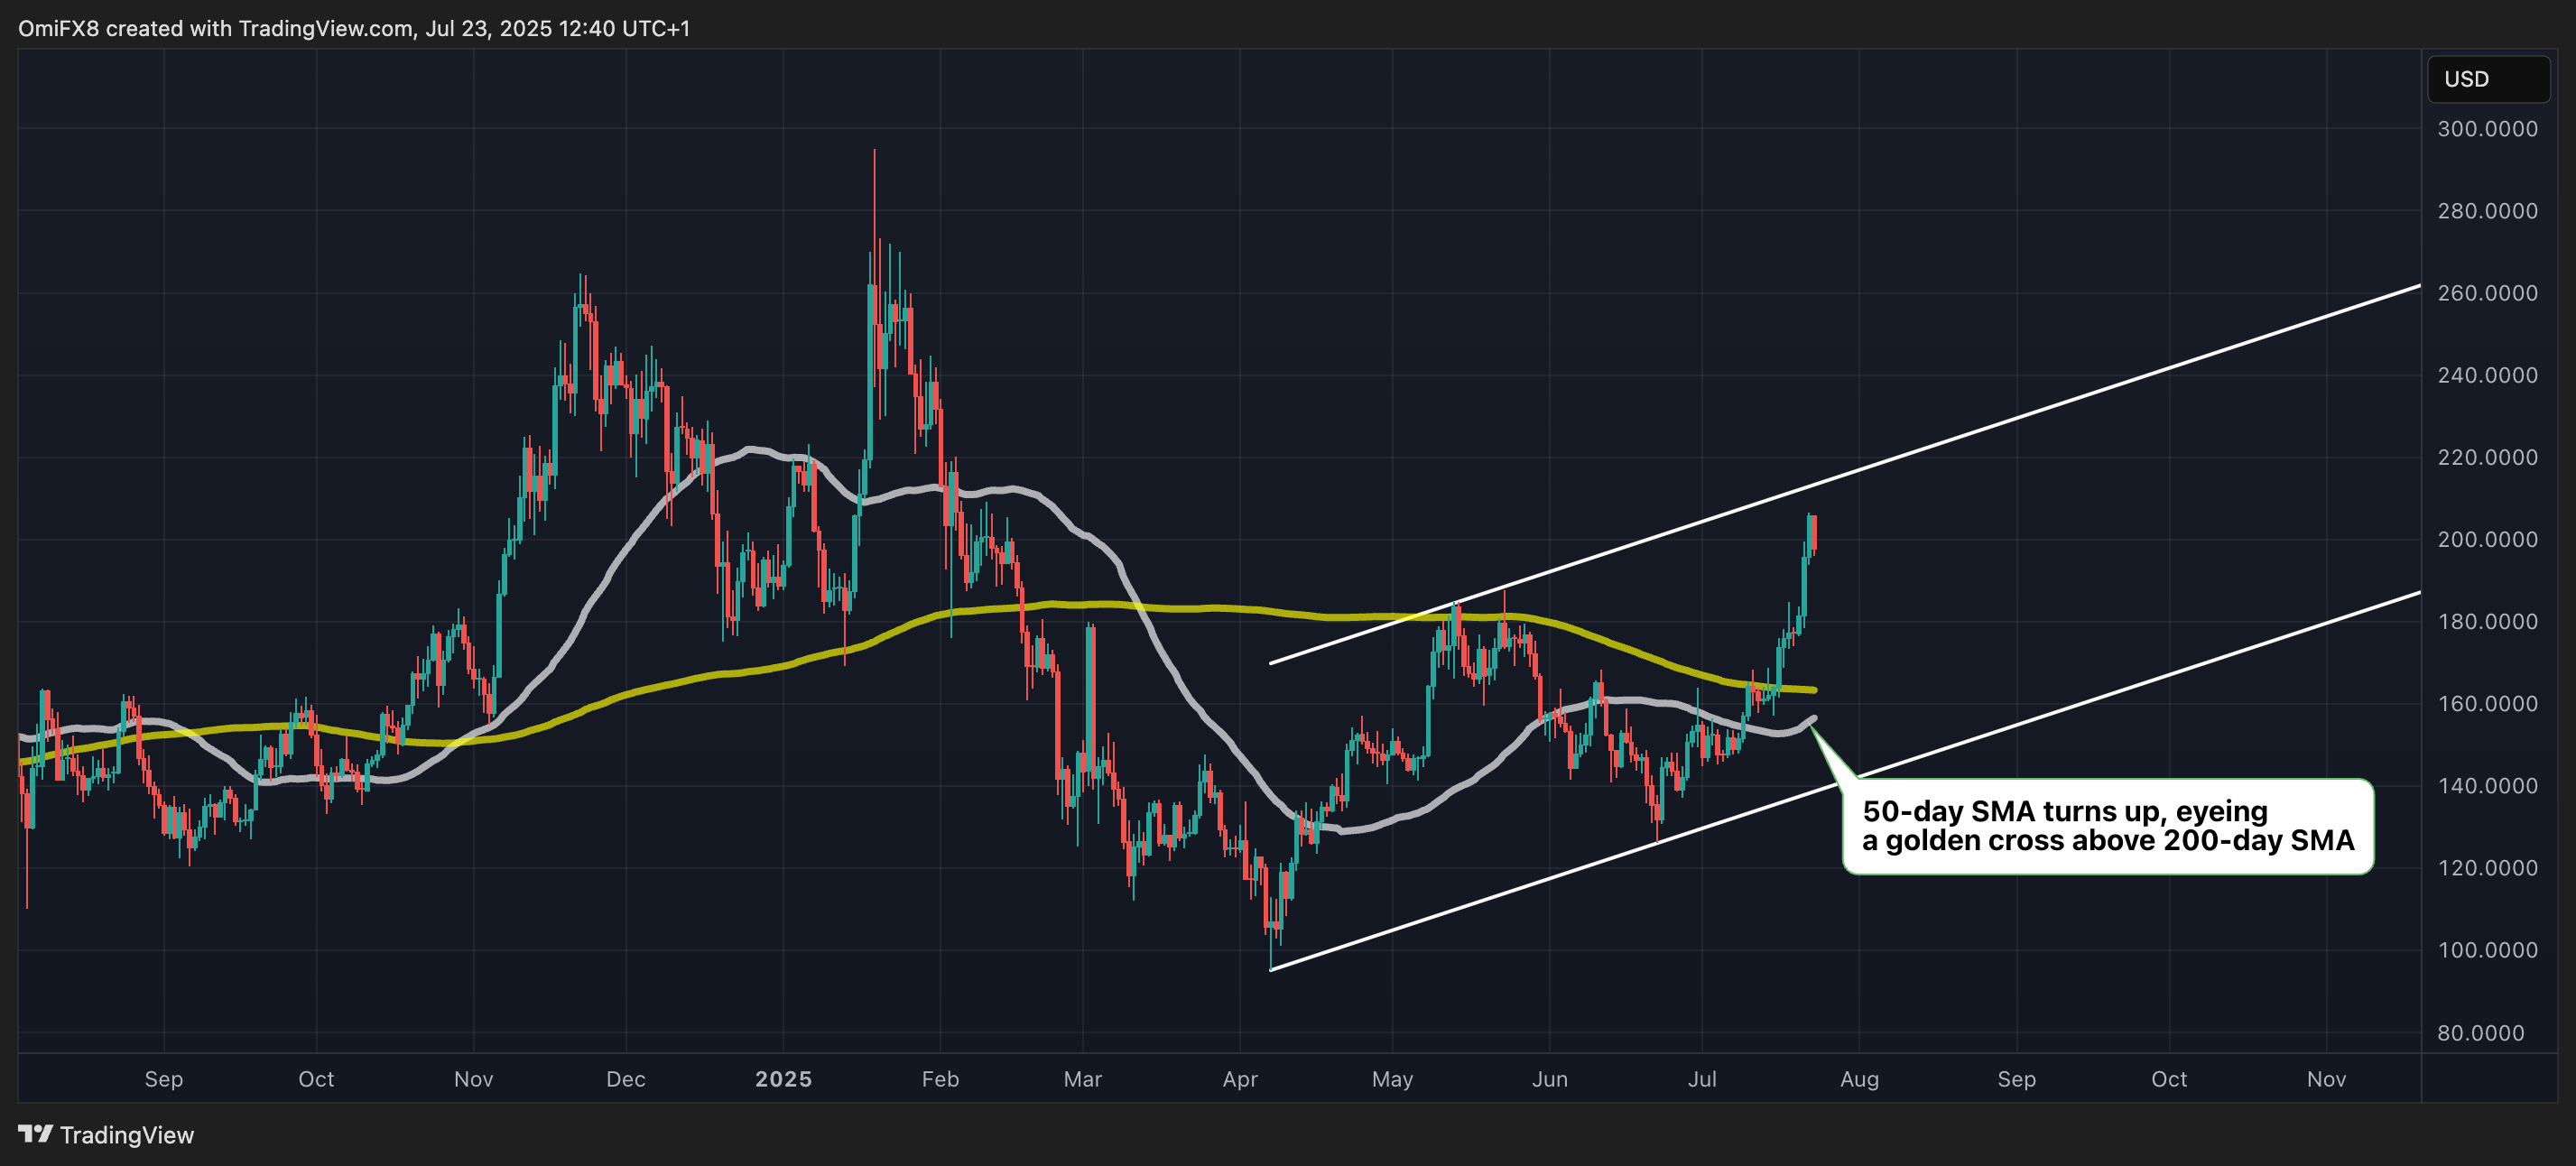
Solana’s SOL (SOL) has retreated below $200 at the time of writing. Nonetheless, the bullish case remains strong, as indicated by the upward trend in both intraday and daily chart moving averages.
The Bollinger Bands have reached their widest since the first quarter, ending a prolonged period of low volatility and suggesting a positive trend. Additionally, the 50-day simple moving average (SMA) is on course to cross above the 200-day SMA, forming a bullish golden cross.
This suggests that SOL could reach the upper boundary of the rising channel with potential moves to $215 and beyond.

- AI’s Insight: The price action remains within a well-defined ascending channel, indicating a steady uptrend from April’s lows. The recent breakout into the upper half of this channel further supports the bullish momentum.
- Resistance: $218, $252-$264.
- Support: $187-$185, $163 (the 50-day SMA), $145.
Read more: Unveiling Hidden Unemployment in Blockchain? Data Shows Only a Fraction of Ethereum and Solana Protocols Generate Revenue


