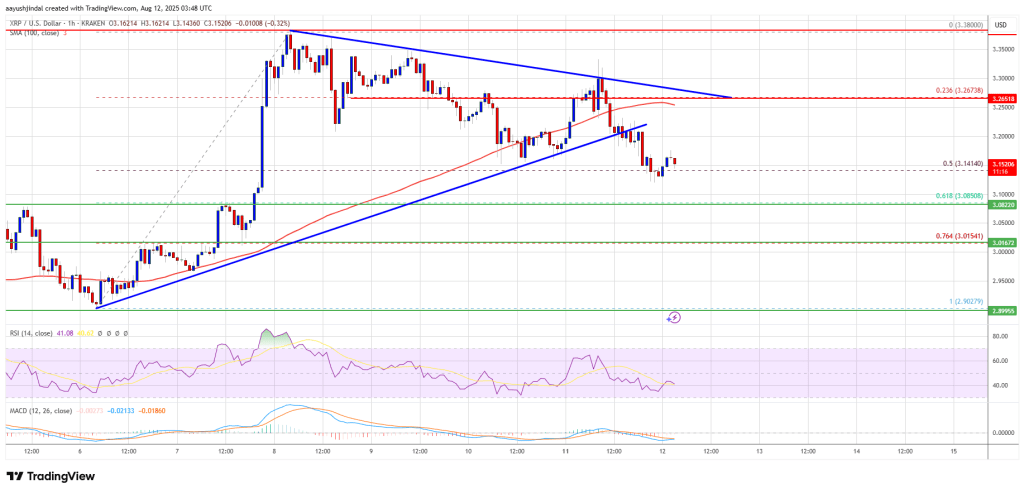
Recent market movements have put XRP price in a precarious position as it corrects gains below the $3.25 zone, prompting bulls to adopt a defensive stance. The price is currently consolidating and there are concerns that it might dip below the $3.080 support zone in the near term.
- Despite efforts, XRP price is facing challenges in settling above the $3.250 zone.
- Currently, the price is trading below $3.250 and the 100-hourly Simple Moving Average, indicating a bearish trend.
- A significant development was the break below a key contracting triangle with support at $3.20 on the hourly chart of the XRP/USD pair, according to data sourced from Kraken.
- However, there remains a possibility of another price increase if the pair manages to stay above the $3.080 zone.
Exploring XRP’s Price Movement
Following a period where XRP price established a base above the $2.920 level, it embarked on a fresh uptrend akin to Bitcoin and Ethereum. The momentum saw the price surge above the $3.20 and $3.25 resistance levels.
Despite reaching a high of $3.380, the bears intervened, leading to a correction in price. Notably, there was a dip below the $3.250 level and a subsequent break below the 23.6% Fib retracement level of the upward move from the $2.90 swing low to the $3.380 high.
The hourly chart of the XRP/USD pair also witnessed a break below a critical contracting triangle with support at $3.20, with the price now trading below $3.220 and the 100-hourly Simple Moving Average.

Looking ahead, hurdles are anticipated near the $3.20 level, with the first major resistance at $3.220. A successful breach of this level could propel the price towards the $3.2650 resistance, followed by potential targets at $3.320 and $3.350 in the short term. The $3.450 zone looms as the next significant challenge for the bulls.
Evaluating Potential Losses
If XRP struggles to surpass the $3.220 resistance zone, a fresh decline may ensue. Initial support is anticipated near the $3.120 level, followed by a critical support zone near $3.080 or the 61.8% Fib retracement level of the recent upward move.
A sustained downside break below $3.080 could lead to further declines towards the $3.020 support, with the $3.00 mark representing a pivotal level where bullish momentum could potentially resurface.
Technical indicators suggest a bearish trend, with the MACD for XRP/USD showing momentum in the bearish zone and the RSI below the 50 level.
Key Support Levels: $3.120, $3.080
Key Resistance Levels: $3.220, $3.2650


