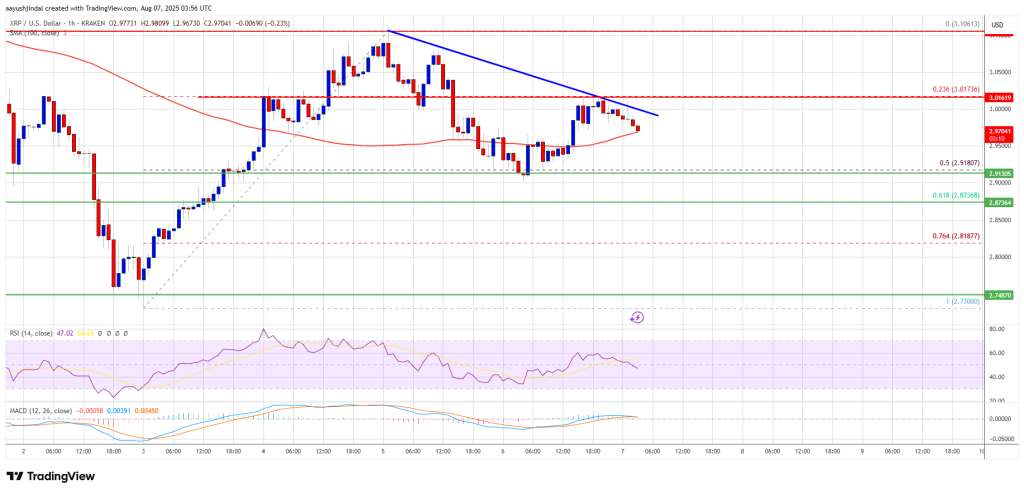
XRP is facing challenges ascending above the $3.020 mark, with its price consolidating and possibly slipping beneath the $2.920 support level.
- XRP is adjusting from the $3.10 level gains.
- Currently, the price hovers around $2.980, coinciding with the 100-hourly Simple Moving Average.
- A bearish trend line is emerging, with resistance at $3.020 on the hourly XRP/USD chart (data via Kraken).
- The pair may see an upward movement if it remains above the $2.880 threshold.
Resistance Hinders XRP’s Progress
Similar to Bitcoin and Ethereum, XRP couldn’t break through the $3.10 resistance barrier, forming a short-lived peak before dropping below $3.020.
It slipped under the $3.00 mark, further declining past $2.950, testing the 50% Fib retracement from the $2.730 low to the $3.106 peak. Despite this, support was evident around $2.920.
XRP is now positioned near $2.980 alongside the 100-hourly Simple Moving Average. Resistance could surface near the $3.00 mark, paired with a bearish trend line at $3.020 on the hourly XRP/USD chart.

The primary resistance is positioned at $3.10. Surpassing this could propel the price towards $3.120. Further gains might push it to $3.180 or even $3.20 soon. The next significant resistance for bulls is at $3.250.
Potential for Another Downturn?
Failure to surpass the $3.020 resistance could trigger another decline. Initial support lies around $2.920, followed by a critical level at $2.880 or the 61.8% Fib retracement from the $2.730 low to the $3.106 high.
A breach below the $2.880 mark might lead to a decline towards $2.810, with further support expected around $2.750 where bulls may intervene.
Technical Indicators
Hourly MACD – The XRP/USD MACD is slowing down in the bearish territory.
Hourly RSI (Relative Strength Index) – XRP/USD’s RSI is under 50.
Key Support Levels – $2.920 and $2.880.
Key Resistance Levels – $3.020 and $3.10.


