The ongoing debate about whether a significant drop below the $105,000 mark would signal the end of the Bitcoin bull market has elicited a strong response from renowned market analyst CrediBULL Crypto (@CredibleCrypto). In a couple of late-night tweets addressed to his 476,000 followers, he contended that although $105,000 represents a crucial level for the “most aggressive” upward trajectory, a decline below this point would not automatically signify the conclusion of the broader uptrend.
“No, losing $105,000 doesn’t mean it’s ‘game over’; it merely indicates that the most bullish scenario is off the table and a deeper correction becomes more probable,” he stated. “The higher-time-frame structure remains intact until we breach the $74,000 mark—details of which are covered in my latest YouTube video, so please check that out before questioning the validity of this level! :)”
In a follow-up tweet, he reinforced a critical point that has shaped his perspective for several weeks: “$107,000 to $110,000 has consistently been the MOST crucial area on the BTC chart… This region is the most likely candidate for a significant reversal. While it’s not guaranteed, this is the last point where it makes sense to adopt a bearish stance.”
What’s the Potential for Bitcoin to Decline?
These comments refer back to a YouTube video released two weeks prior, in which the analyst outlines three possible trajectories for Bitcoin’s next phase. Two of these scenarios anticipate an upward reversal around the current range of $107,000 to $110,000, while the third allows for a deeper correction without breaking the long-term uptrend.
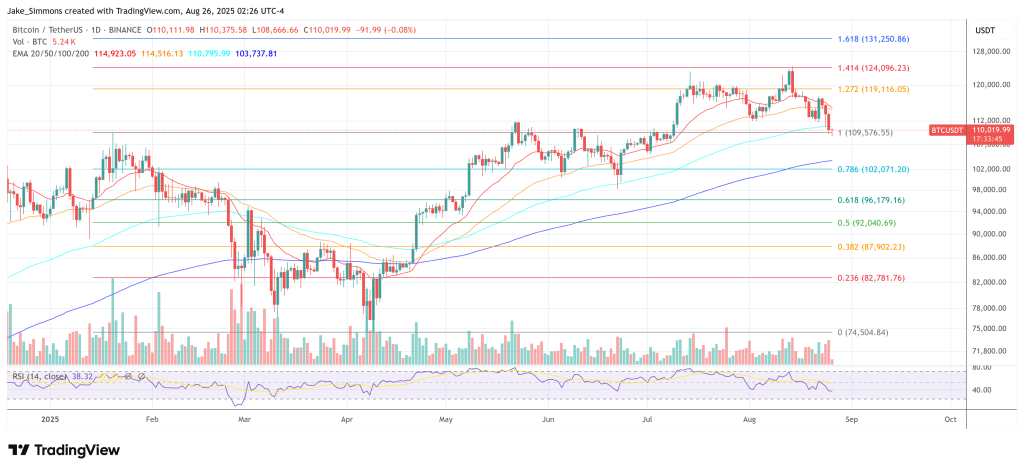
He clarifies that a trend invalidation for this cycle occurs significantly lower—specifically, he identifies the “mid-$70,000s” as the critical threshold, with formal invalidation set at $74,000 to $75,000. This is where the previous high-time-frame impulse began, and, in Elliott-wave terms, this level would negate the larger five-wave structure. Thus, a fall below $105,000 would indicate a loss of upward momentum rather than a complete structural breakdown.
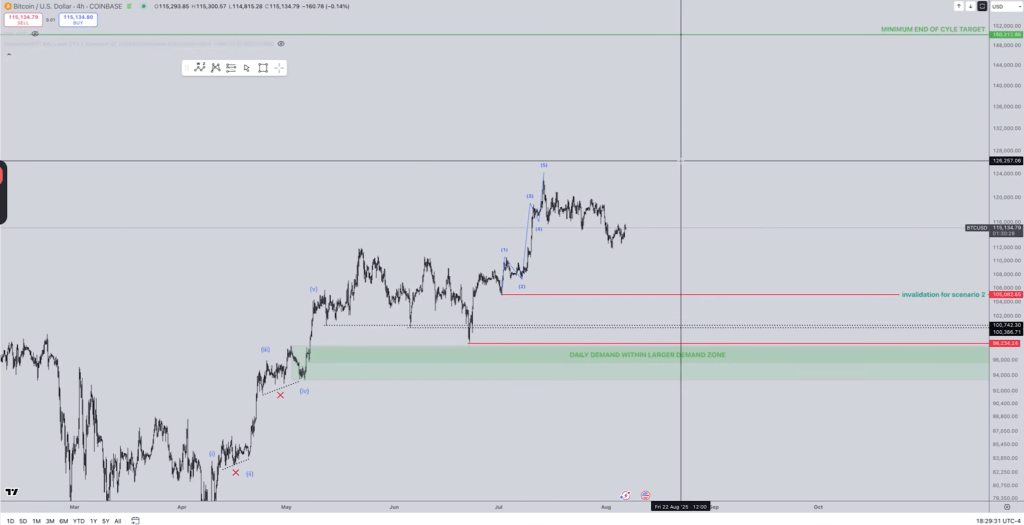
Within his framework, “Scenario 1″—the notion that prices are still engaged in a compact fourth-wave pause within an ongoing impulse—has, by his own admission, become less likely. The extended corrective phase has lasted too long and retraced too deeply compared to its second-wave counterpart; thus, it fails to meet the criteria for a fourth wave. The critical level for this scenario was $110,000; once surpassed to the downside during the correction, the symmetry of this wave count was compromised.
“Scenario 2,” which is his favored bullish outlook, posits that the rally originating from around $105,000 represents the completion of a new five-wave impulse. In this scenario, the market is currently experiencing a wave-two pullback with a strict invalidation point at $105,000.
The implications are both structural and arithmetic: if the first wave spanned roughly $20,000, a conventional third wave would be expected to exceed this, reaching at least the mid-$130,000s before a fourth wave pause and a final fifth wave that could push the price beyond $150,000. This is why he labels the $107,000 to $110,000 range as the “best risk/reward for long positions,” marking the last high-probability area for a reversal before invalidation occurs.

“Scenario 3” maintains the broader correction that has been ongoing since May. In this case, the rise above range highs was corrective rather than impulsive—what technicians refer to as a three-leg rise with overlaps—and the market is expected to undergo a deeper pullback into demand.
He outlines two potential patterns: a running flat that preserves the June/July lows and finds support in a range between approximately $103,000 and $98,000, and an expanded flat that dips below those lows, testing the daily demand block that “began at basically 98k,” which the price approached at $98.2k before bouncing back. In both scenarios, the higher-time-frame thesis remains intact, as the structural invalidation level is still significantly lower at $74,000 to $75,000.
As of the latest update, Bitcoin is trading around $110,019 after reaching an intraday low of $108,666.


