Recent on-chain analytics highlight a deceleration in capital inflows for Bitcoin and Solana, while Ethereum maintains robust growth.
Divergent Trends in Realized Capitalization: Ethereum vs. Bitcoin
Glassnode, an on-chain analytics company, recently shared insights on how the Realized Capitalization for certain cryptocurrencies has evolved. The “Realized Cap” is a unique way to assess a coin’s total market value by considering the transaction price of each token in circulation as its ‘true’ value.
This metric essentially represents the cumulative capital investors have put into a cryptocurrency. Thus, shifts in its value indicate either the influx or withdrawal of capital.
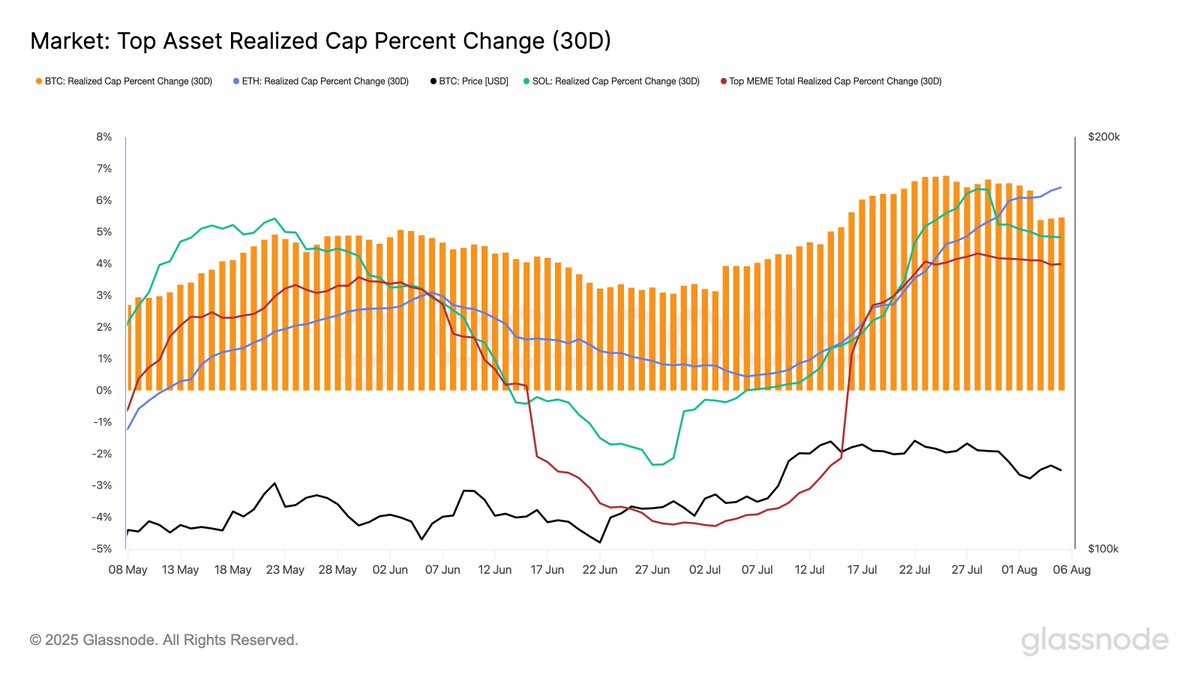
Glassnode’s chart below illustrates the 30-day percentage change in Realized Cap for various digital currencies.
The graph demonstrates that the Realized Cap has increased for Bitcoin, Ethereum, Solana, and leading memecoins over the past month, indicating positive capital flow into the market.
However, Bitcoin and Solana have shown a recent decline in this growth rate. A week ago, their Realized Cap changes were 6.66% and 6.34%, respectively, but have now fallen to 5.46% and 4.84%. Although these numbers remain positive, they do suggest a decrease in demand.
Conversely, Ethereum’s Realized Cap continues to rise, with its percentage change increasing from 5.32% to 6.41%. This trend might suggest that capital is shifting from other assets to Ethereum.
The leading meme-based tokens have seen little change in this metric, according to the analytics firm, indicating a “cooling risk appetite.”
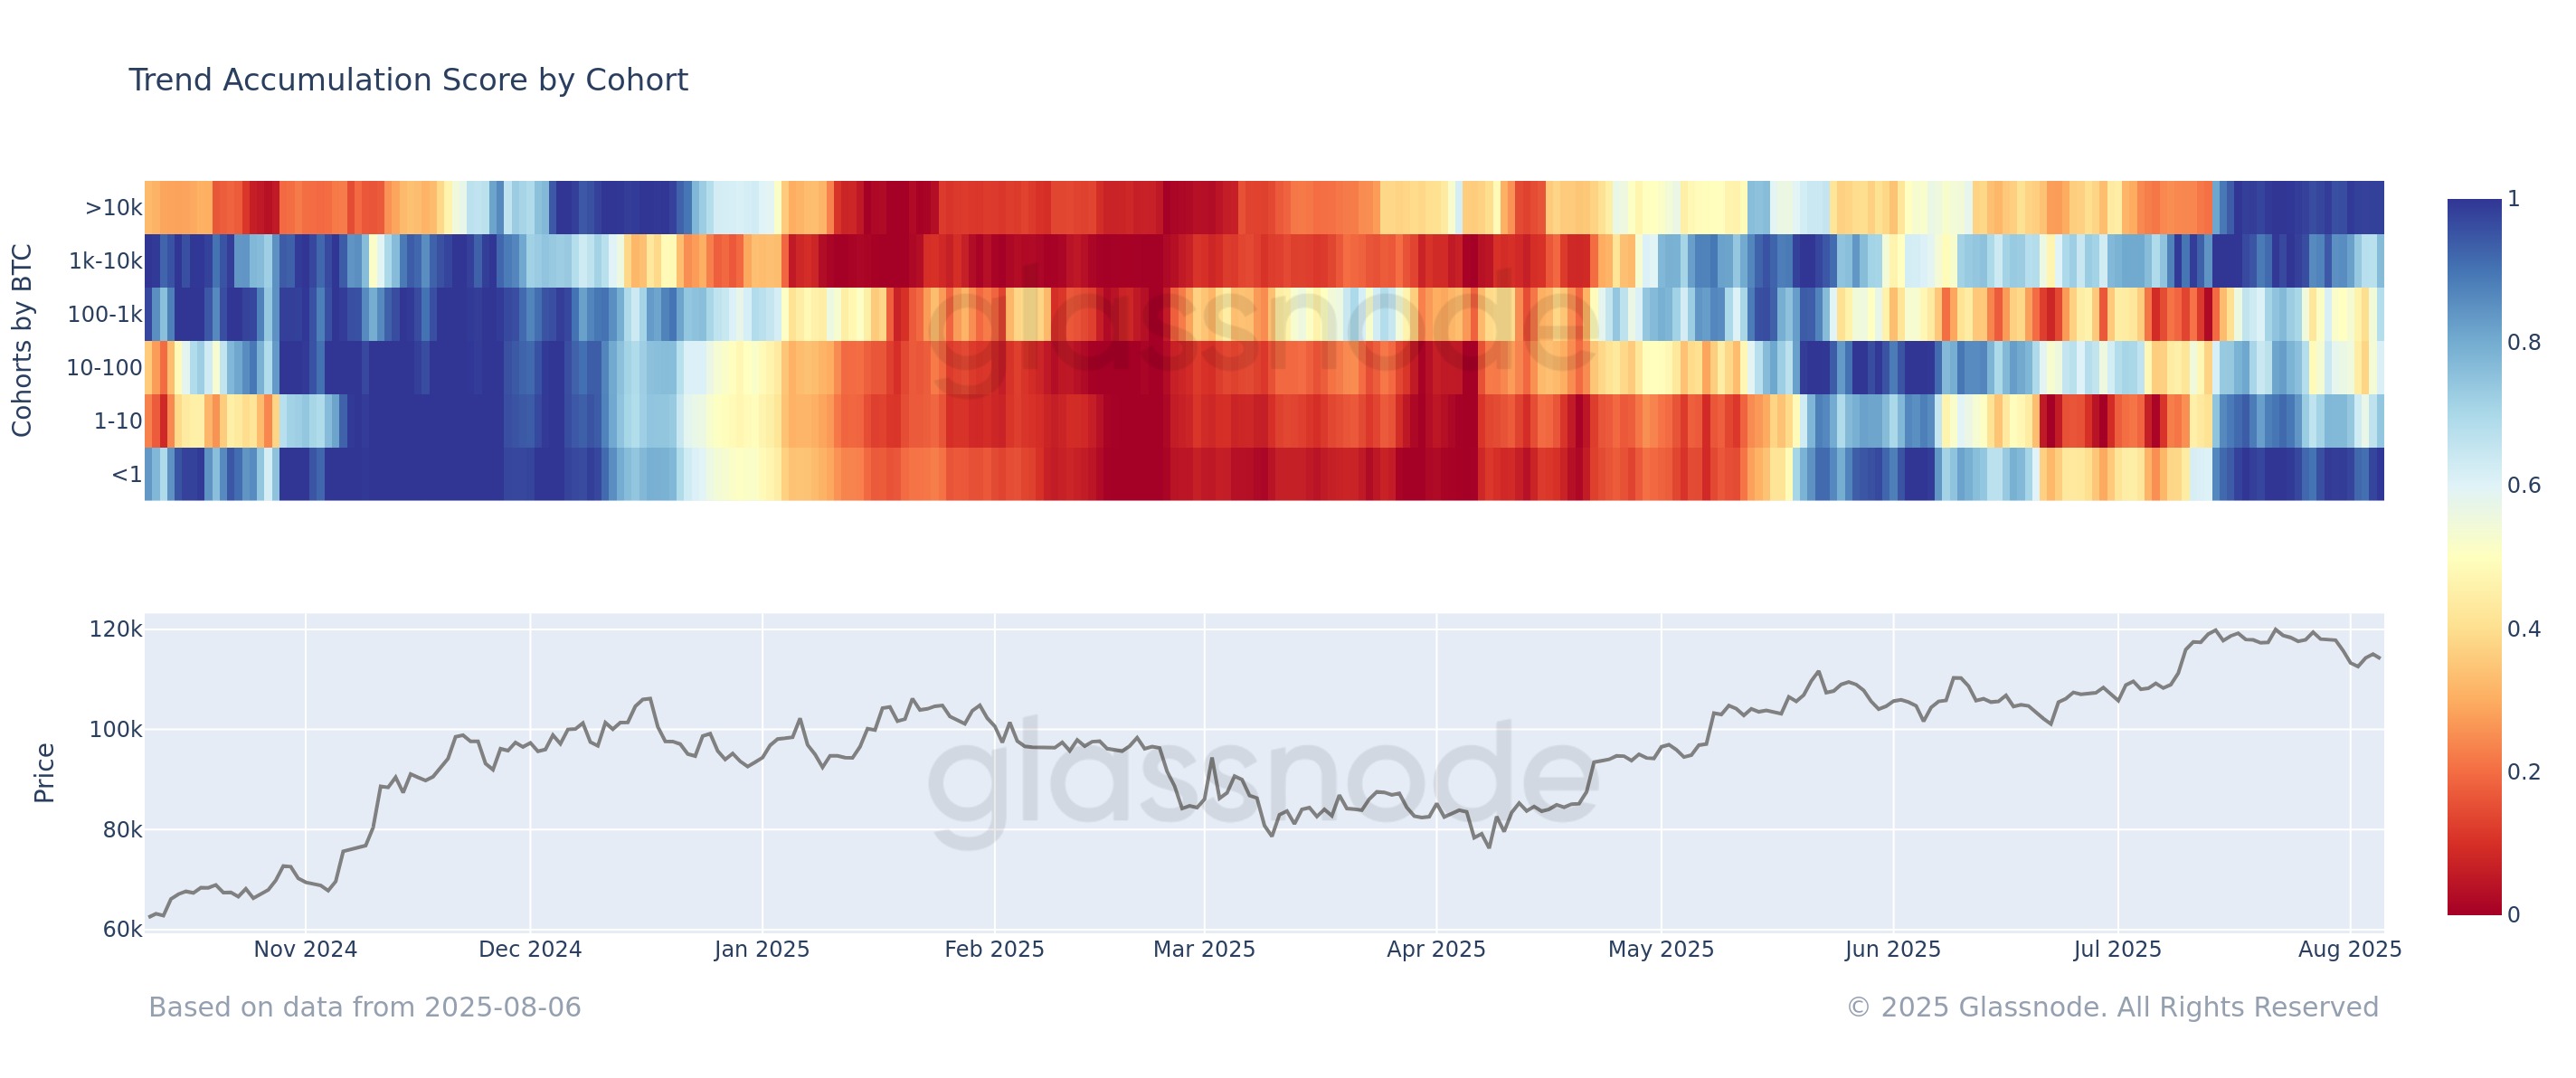
In other developments, both major and minor investors on the Bitcoin network have been accumulating simultaneously, as highlighted by another Glassnode post.
The “Accumulation Trend Score” chart indicates whether Bitcoin investors are buying or selling. A value near 1 signals strong buying activity, while a value close to 0 indicates selling pressure.
The chart shows that both investors holding less than 1 BTC and those with over 10,000 BTC have scores close to 1. “This implies initial dip-buying during the recent correction,” states Glassnode. However, the firm also warns that the metric is lagging due to a 15-day smoothing window.
Bitcoin’s Current Price
As of now, Bitcoin is trading around $115,100, reflecting a decline of over 2% in the past week.


