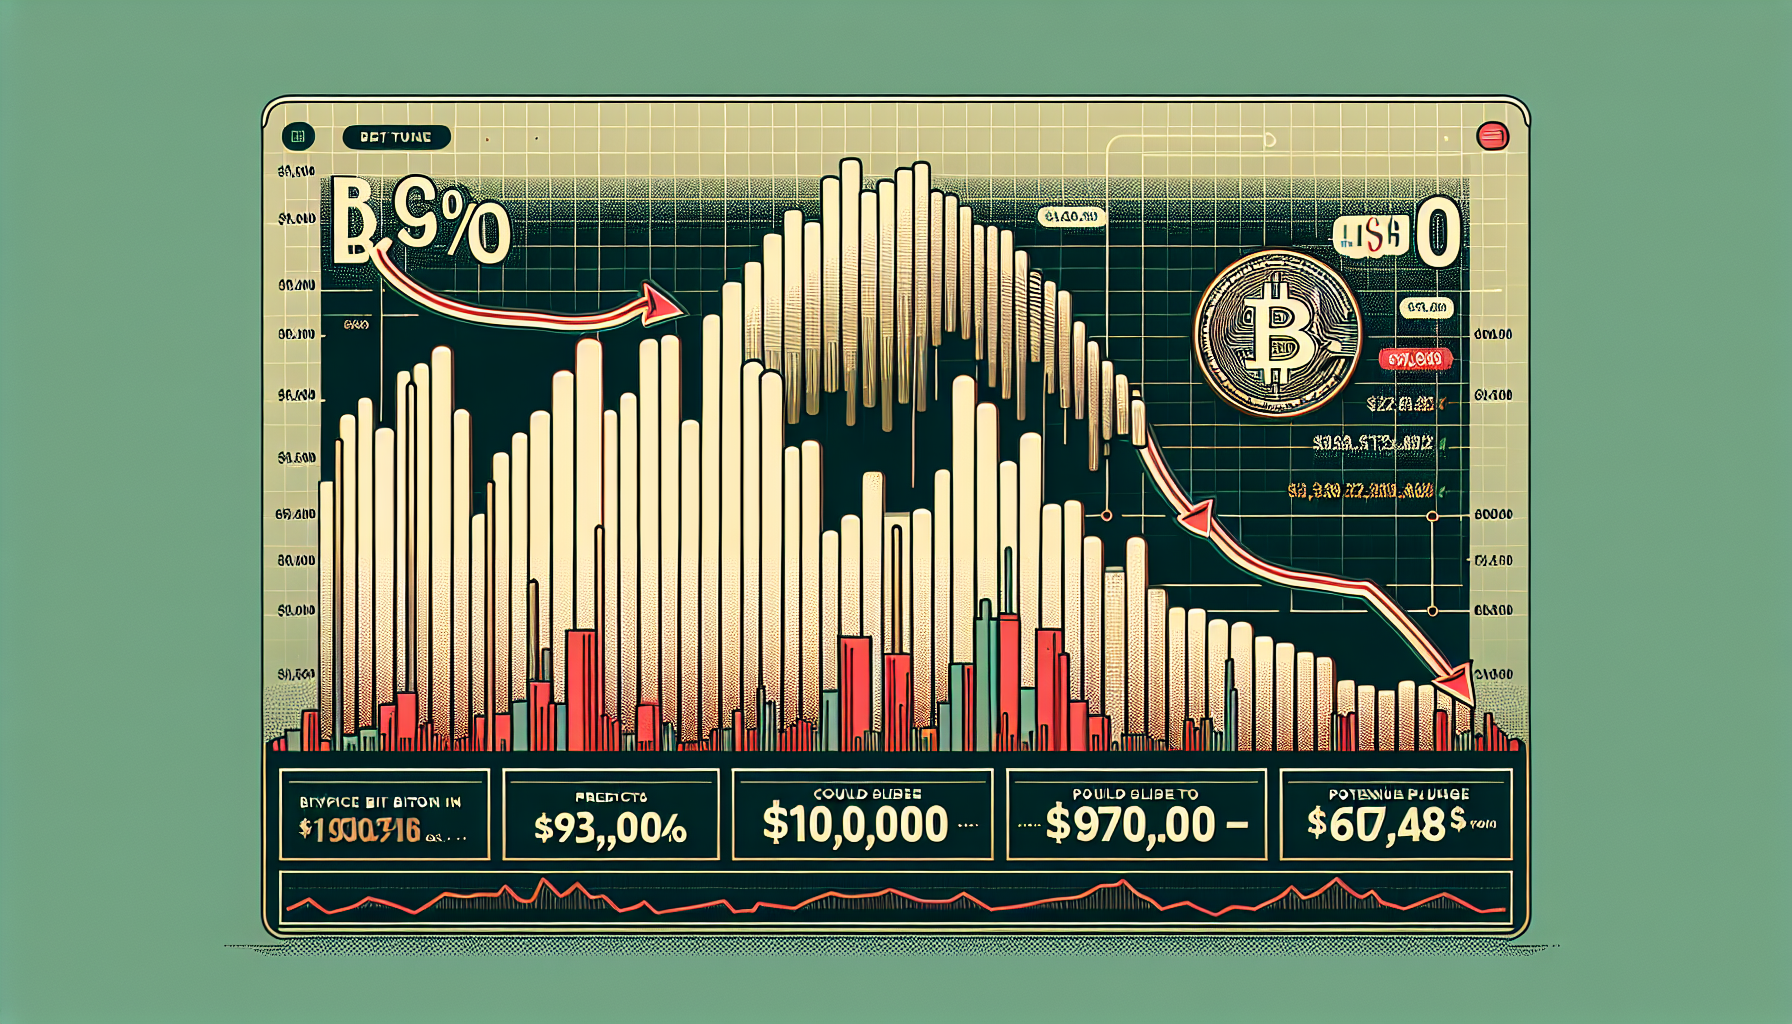
After reaching a fresh all-time high last month, Bitcoin has pulled back by more than 10%, slipping below the $110,000 mark as traders take profits. That selling pressure has persisted into the new month, with frequent sell-offs and growing bearish sentiment. While some market observers have suggested a bottom might be forming, analyst MMBTtrader argues the downturn may only be beginning and that further losses are likely. Why a Drop to $93,000 Seems Probable According to MMBTtrader’s technical read, Bitcoin is facing substantial downside pressure. The $108,000 area has served as short-term support so far, but sellers remain dominant and that level could fail. The analyst points to a long-term trendline that began in 2024: a retest of that trendline would likely push price lower, with the next meaningful contact estimated around $93,000. Even if the trendline provides temporary support at that retest, momentum indicators do not favor an immediate recovery. MMBTtrader warns that after hitting roughly $93,000, Bitcoin could break down further — potentially easing as low as $70,000 if selling intensifies and a cascading liquidation occurs. Bull Case — What Would Change the Outlook There is a clear bullish scenario if buyers can reclaim the trendline and lift price back above roughly $117,000. In that case, the analyst projects a possible continuation higher that could translate into an approximate 30% rally, taking Bitcoin back above the $137,000 area. Still, MMBTtrader emphasizes that the downside looks more likely at present, noting a higher probability of a downward breakout and subsequent further declines than of an immediate bullish reversal. Charts shared by the analyst (TradingView snapshots referenced in the original analysis) illustrate the trendline, the $108,000 short-term support, the potential retest near $93,000, and the upside target above $137,000, framing both the bearish and bullish scenarios.


