Bitcoin experienced a slight pullback yesterday, slipping a bit but continuing to trade within a narrow band defined by significant support and resistance levels. While the larger altcoin market is enduring increased volatility and substantial losses, BTC shows relative stability, although its momentum remains ambiguous. Experts caution that a weakening sentiment could lead to a more extensive market correction.
Prominent analyst Darkfost emphasized a vital trend currently in play: the fragility of Short-Term Holders (STH). These investors, who entered the market during recent price hikes, hold Bitcoin at much higher cost bases. When price movements stall or decline, they are often the first to sell, increasing the selling pressure.
With altcoins already under strain, the focus remains on whether Bitcoin can maintain its current support levels or if it will succumb to short-term selling pressures. This period could serve as a stress test for new investors, while long-term holders and institutional players keep an eye on crucial price thresholds.
Analysis of Realized Price Levels Indicates Bitcoin’s Bullish Structure
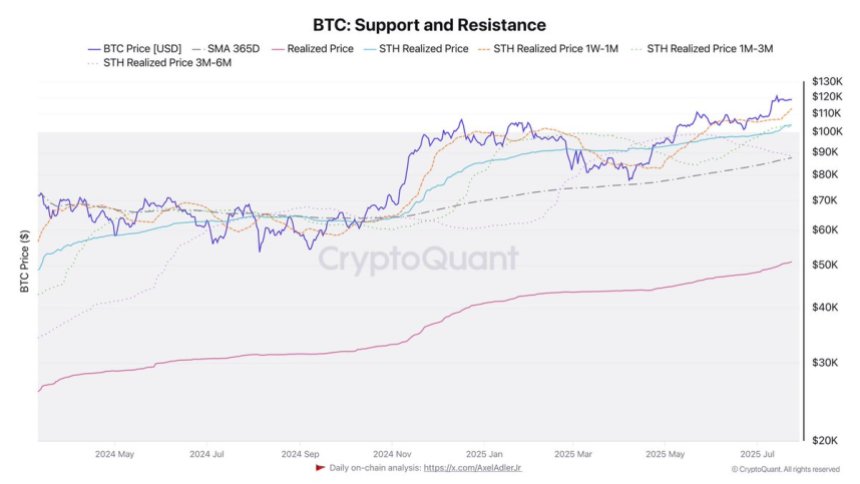
Darkfost provided a chart offering an in-depth analysis of Bitcoin’s realized prices across different holding groups, with a particular focus on Short-Term Holders (STHs). These metrics are essential in identifying support zones that might be defended if prices continue to decline in the short term.

The current broader realized price for Bitcoin is $50.8K, with the annual average significantly higher at $87.5K. Notably, the realized price for STHs—those who have recently purchased coins—stands at $103.9K. Breaking this down further by holding duration:
- STH 3m–6m: $88.2K
- STH 1m–3m: $104.1K
- STH 1w–1m: $113K
These figures indicate the average purchase price for different groups of recent investors and act as psychological and technical support during market corrections.
As Bitcoin consolidates after a minor pullback, bullish investors are closely watching these realized price zones to assess if the bullish structure persists. The $104K level is particularly crucial, aligning closely with the 1m–3m STH realized price and potentially serving as a pivotal point for market sentiment and price defense.
If Bitcoin remains above this level, the bullish market structure is likely to hold, suggesting a healthy consolidation rather than a trend reversal. Conversely, falling below it could lead to short-term panic selling among recent buyers.
Bitcoin Price Overview: Key Levels Intact After Recent Highs
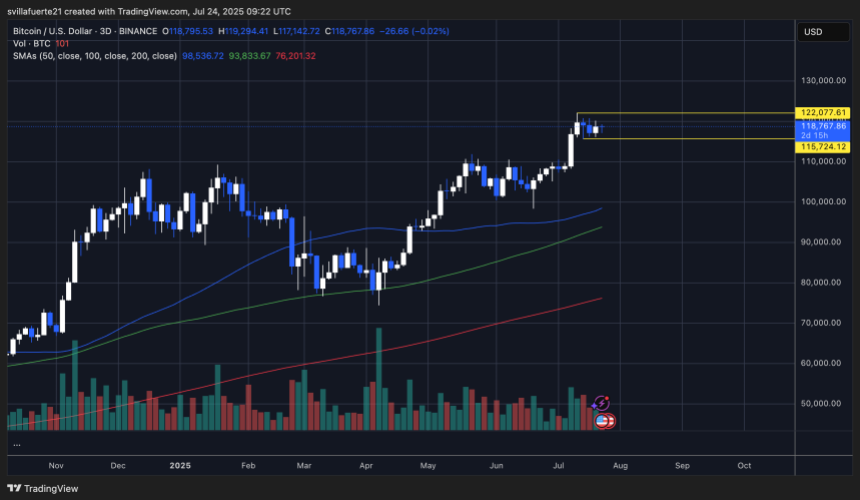
Bitcoin is currently consolidating within a narrow range after achieving new all-time highs earlier this month. The 3-day chart shows BTC maintaining a position above the critical horizontal support at $115,724, while facing immediate resistance near $122,077. This consolidation range has been stable for over a week, indicating both strong demand and caution around psychological resistance levels.

Despite the recent minor decline, the overall market structure remains bullish. The price is trading well above the 50-day ($98,536), 100-day ($93,833), and 200-day ($76,201) simple moving averages, which continue to rise, confirming strong medium- and long-term momentum.
Trading volume has decreased slightly during this current range-bound phase, indicating a pause following the aggressive rally from below $100,000. However, bullish investors are actively defending the $115,000–$116,000 area, a zone that aligns with the top of the previous breakout.
Featured image from Dall-E, chart from TradingView


