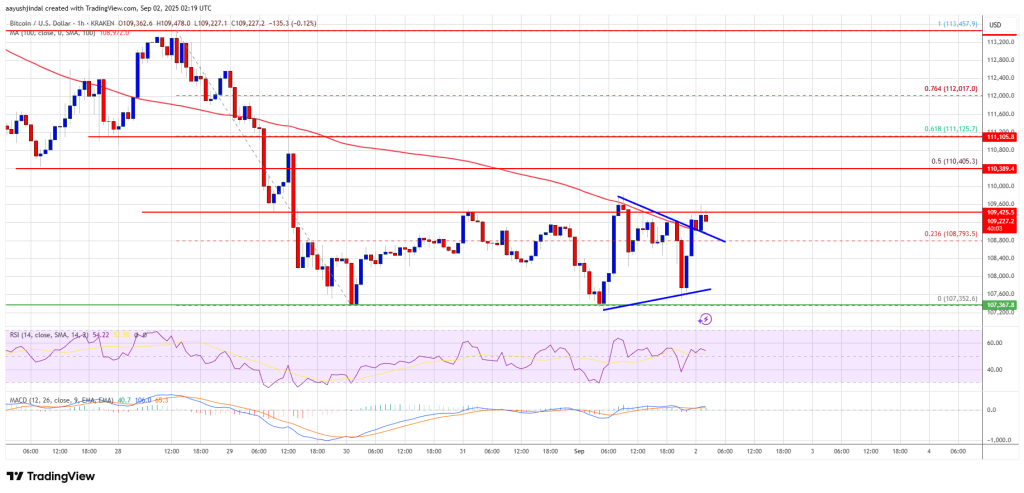
Bitcoin remains under pressure after slipping from recent highs and is consolidating below the $110.5K area. BTC is attempting a short-term recovery but faces immediate resistance around $109.5K and $110.5K.
- BTC recently resumed downside momentum after failing to sustain higher levels.
- The pair is trading below the $110,500 mark and underneath the 100-hour simple moving average.
- An hourly chart breakout occurred above a short-term contracting triangle with resistance at $108,800 (BTC/USD data feed from Kraken).
- If the price cannot hold above the $110,500 zone, another leg down is possible.
Bitcoin Enters a Consolidation Phase
After finding support near $107,350, Bitcoin staged a modest rebound. BTC climbed past resistance at roughly $108,200 and $108,400.
The rebound pushed price above the 23.6% Fibonacci retracement of the decline from the $113,457 swing high down to the $107,352 low. The move also cleared a short-term contracting triangle whose resistance sat at about $108,800 on the hourly BTC/USD chart (Kraken feed).
Despite those gains, selling pressure has appeared near $109,500 and the pair is now consolidating around that level. At present BTC is trading below $110,500 and the 100-hour simple moving average.
Immediate upside resistance sits near $109,500, with the first upside target around $110,200. The next barrier would be near $110,500 — coinciding with the 50% Fibonacci retracement of the drop from $113,457 to $107,352.
Should BTC close decisively above $110,500, upside momentum could accelerate. In that scenario the price may aim for $111,650, and with further strength test $112,500. The larger upside objective remains near $113,500.
Potential for a Renewed Decline
Failure to breach and hold above the $110,500 resistance zone would leave the door open for another downturn. Immediate support is clustered around $108,800, followed by support near $108,200.
Below that, the $107,350 area is the next support level. Continued selling could push BTC toward $106,500 in the near term. The major support level sits at $105,500; a break under that could trigger a sharper decline.
Technical indicators:
Hourly MACD – The MACD is losing momentum within the bearish area.
Hourly RSI (Relative Strength Index) – The RSI for BTC/USD sits above the 50 line.
Major Support Levels – $108,800, $108,200, followed by $108,000.
Major Resistance Levels – $109,500 and $110,500.


